Viewing Status per Media Component on Cluster Manager
You can view status and various configuration information of each Media Component from the Cluster Manager.
| ➢ | To view Media Component status and configuration information: |
| 1. | Open the Media Components table (Setup menu > IP Network tab > Media Cluster folder > Media Components). |
| 2. | Select the required Media Component; the status and configuration information is displayed below the table, as shown in the example: |
Viewing Media Component Status and Information
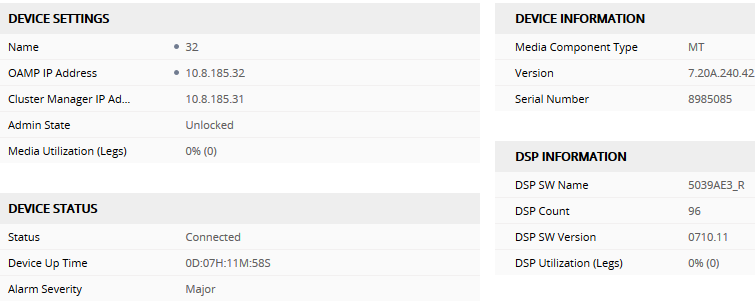
Media Component Status and Information in Media Components Table
|
Parameter |
Description |
||||||||||||||||||||||||||||||
|---|---|---|---|---|---|---|---|---|---|---|---|---|---|---|---|---|---|---|---|---|---|---|---|---|---|---|---|---|---|---|---|
| Device Settings | |||||||||||||||||||||||||||||||
|
Name |
Displays the name of the Media Component. |
||||||||||||||||||||||||||||||
|
OAMP IP Address |
Displays the OAMP IP address of the Media Component. |
||||||||||||||||||||||||||||||
|
Cluster Manager IP Address |
Displays the IP address of the Custer Manager. |
||||||||||||||||||||||||||||||
|
Admin State |
Displays the administrative state of the Media Component, performed by the Cluster Manager:
|
||||||||||||||||||||||||||||||
|
Media Utilization (Legs) |
Displays the percentage (%) of media (RTP/SRTP) capacity currently utilized on the Media Component. It also displays the utilization as a number of legs (ports). For example, if the Media Component supports a maximum of 100 media sessions and 90 are currently in use, utilization is 90% and the number of legs is 180 (i.e., 2 legs per session). |
||||||||||||||||||||||||||||||
| Device Information | |||||||||||||||||||||||||||||||
|
Media Component Type |
Displays the Media Component type ("MC" or "vMC"). |
||||||||||||||||||||||||||||||
|
Version |
Displays the software version currently running on the Media Component. |
||||||||||||||||||||||||||||||
|
Serial Number |
Displays the serial number of the Media Component. |
||||||||||||||||||||||||||||||
| DSP Information | |||||||||||||||||||||||||||||||
|
DSP SW Name |
Displays the DSP software name. |
||||||||||||||||||||||||||||||
|
DSP Count |
Displays the number of DSPs on the Media Component. |
||||||||||||||||||||||||||||||
|
DSP SW Version |
Displays the DSP software version running on the Media Component. |
||||||||||||||||||||||||||||||
|
DSP Utilization (Legs) |
Displays the percentage of DSP resources currently in use on the Media Component. For example, if the DSP resources on the Media Component supports a maximum of 100 AMR-to-G.711 transcoding sessions and only 60 transcoding sessions are currently being processed, DSP utilization is 60% and the number of legs is 120. |
||||||||||||||||||||||||||||||
| Device Status | |||||||||||||||||||||||||||||||
|
Status |
Displays the status of the Media Component:
|
||||||||||||||||||||||||||||||
|
Device Up Time |
Displays the duration that the Media Component is operational after a restart. The duration is displayed in the syntax DD:HH:MM:SS. The duration resets when the Media Component restarts. |
||||||||||||||||||||||||||||||
|
Alarm Severity |
Displays the highest severity of all currently raised SNMP alarms.
|
||||||||||||||||||||||||||||||
|
Network Interface: Displays the IP network interfaces configured on the Media Component (in the IP Interfaces table). |
|||||||||||||||||||||||||||||||
|
Network Group: Displays the Ethernet Groups configured on the Media Component (in the Ethernet Groups table). |
|||||||||||||||||||||||||||||||